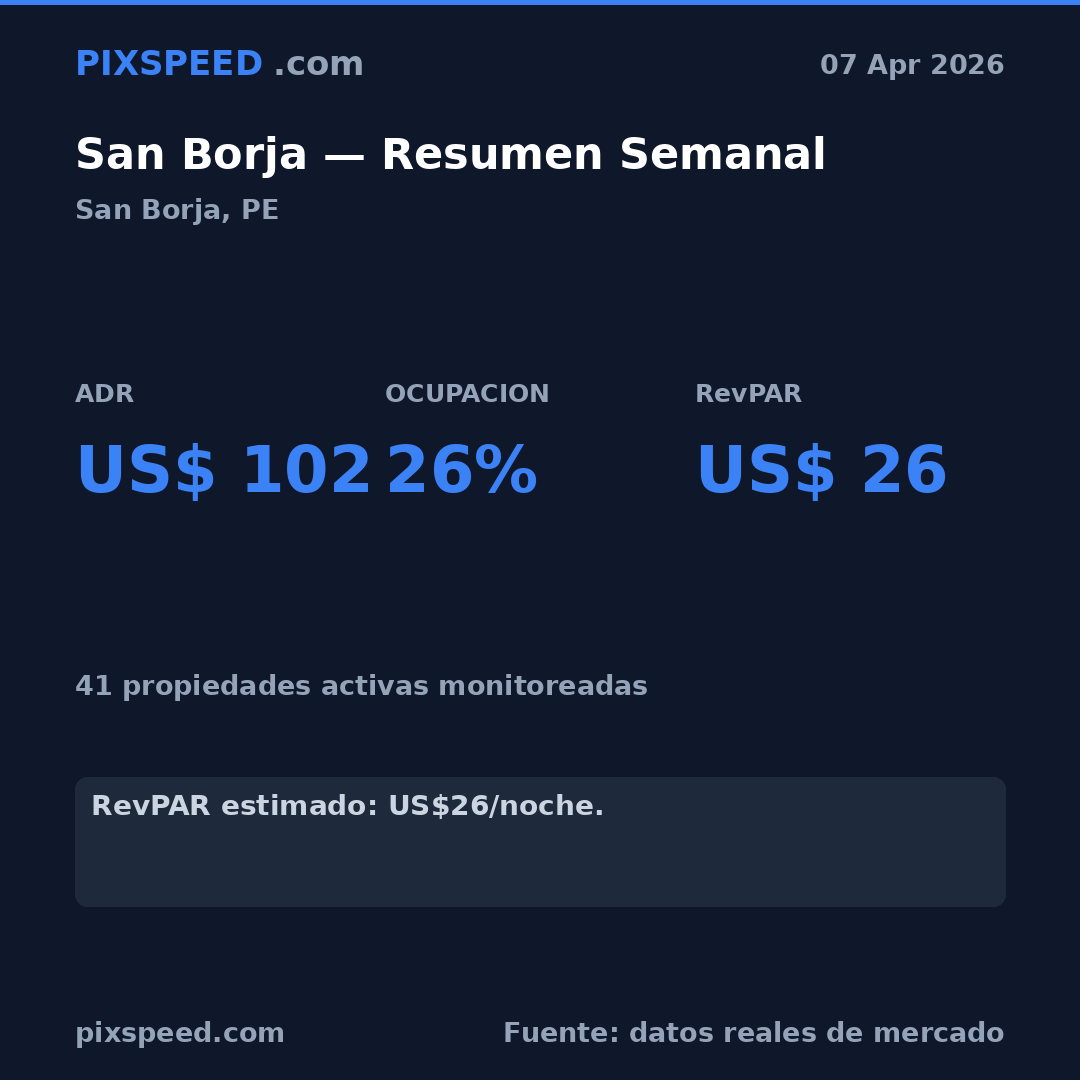
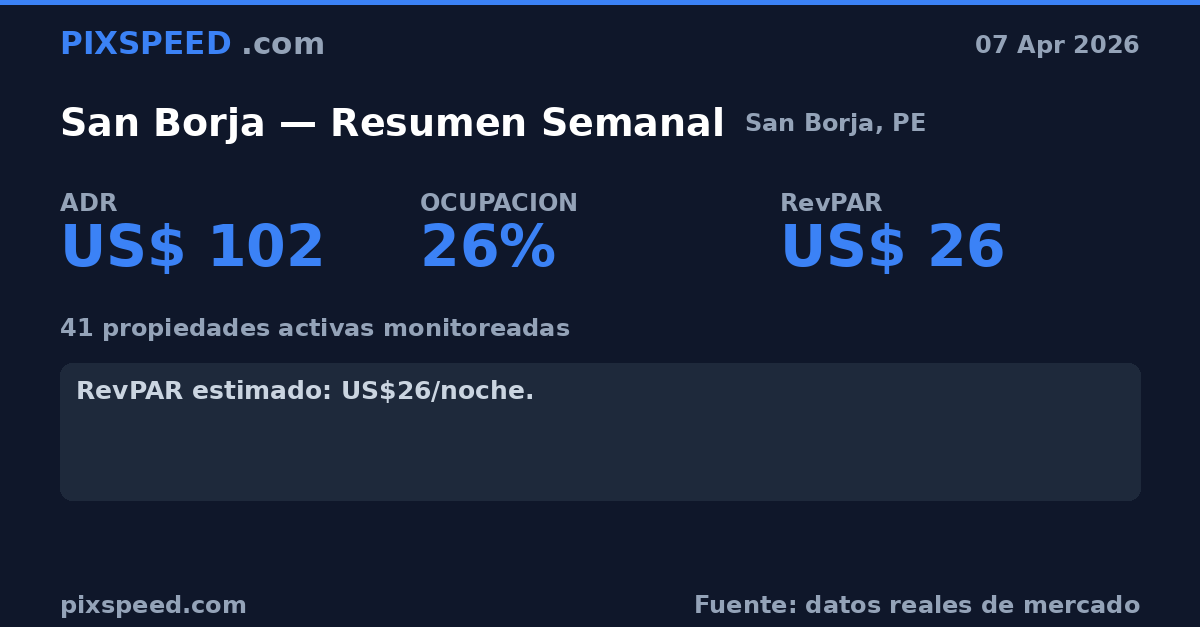
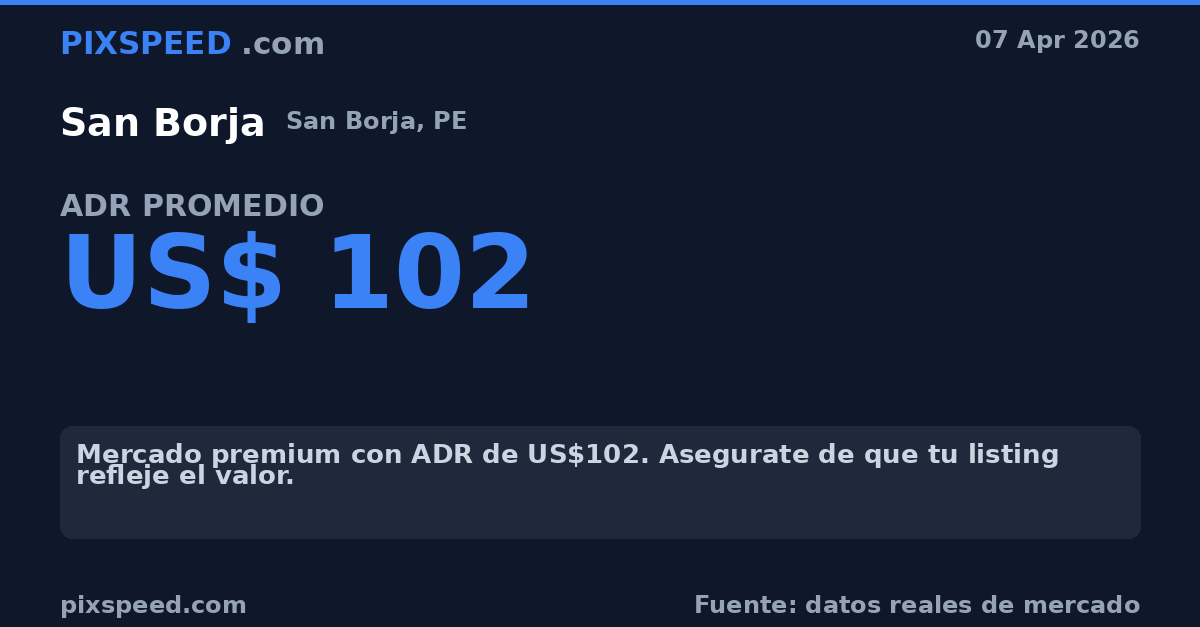
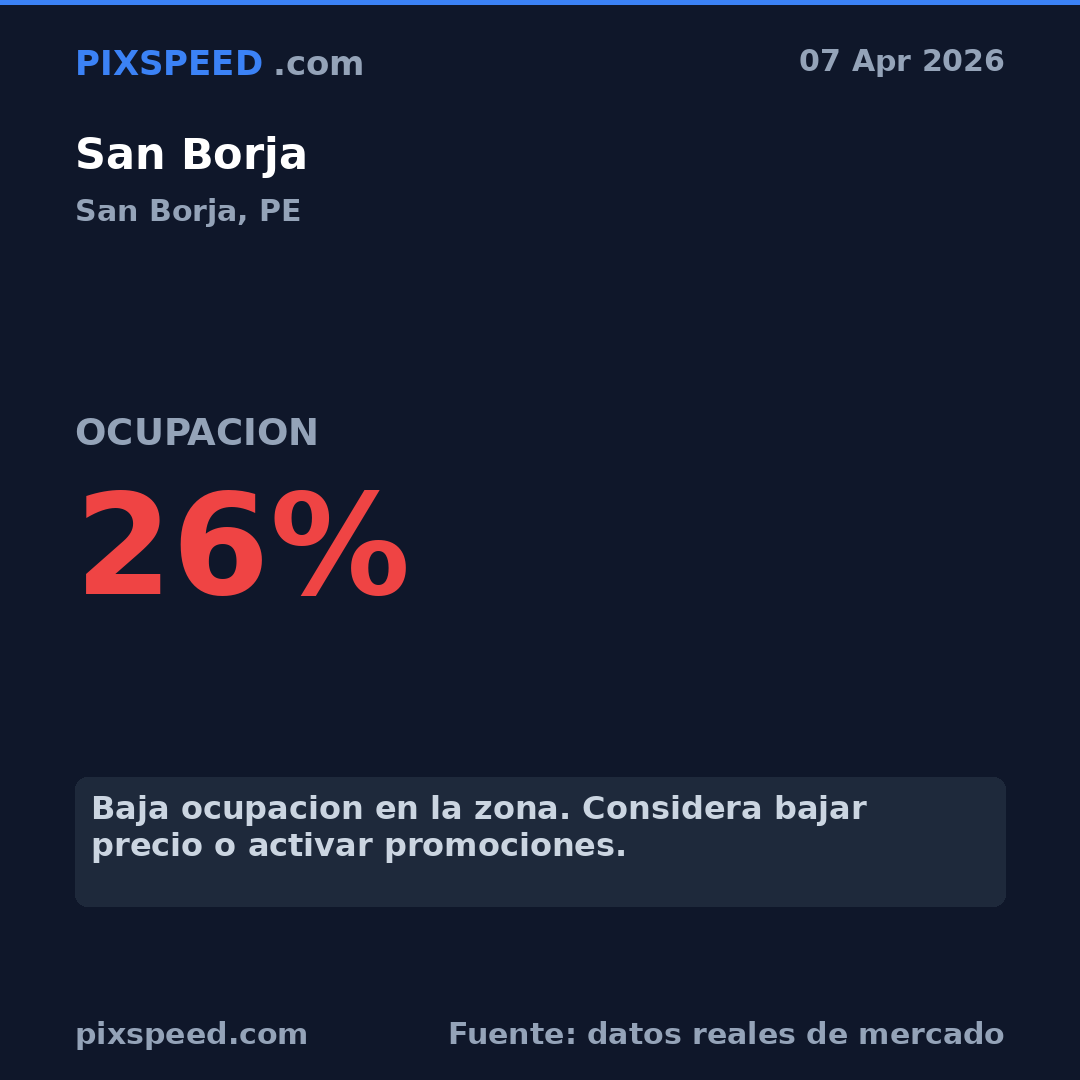
San Borja
Demand and pricing radar for short-term rentals in San Borja.
Daily update · Data as of 7 de abril de 2026 · 41 Monitored listings
Today's summary
Normal compression (26.0%). Stable vs last week.
Maintain current rates.
ADR
US$ 102
+2,9% vs 7d
L-J: US$100 ·
V-D: US$104
Occupancy
26,0%
-0,4 pts vs 7d
RevPAR
US$ 26
+1,3% vs 7d
Compression
26,0%
-0,4 pts vs 7d
Price distribution
P25
US$ 62
Median
US$ 76
P75
US$ 124
Weekend Premium
+3,9%
L-J: US$100 → V-D: US$104
Booking Pace
Stable
22,0% → 26,0%
(+3,9 pts)
Market trends (30 days)
Market pricing guide Low demand
Demanda baja — considera promociones.
High demand
US$ 84 - 161
Normal
US$ 62 - 124
Low demand
US$ 53 - 76
Median: US$ 76
Weekend premium: +3,9%
Monitored listings
41
Instant Book
24%
Average rating
4,91
Next 14 days
3 day(s) MODERATE
12 day(s) normal
Hottest dates
07 Abr
65,9%
08 Abr
61,0%
09 Abr
56,1%
Upcoming holidays (60 days)
01 May 2026
Dia del Trabajo
26,8%
Compression Calendar
<50% Normal
50-70% Moderate
70-80% High
>80% Extreme
Holiday

Get alerts when San Borja heats up
We'll notify you when there's high demand, price increases, or dates to adjust your rate.
How we calculate
- We monitor listings daily in San Borja. (41)
- Prices and availability are captured from Airbnb for the next 30 days.
- Occupancy is a proxy: percentage of unavailable nights (booked or blocked).